The study, based on more than 12,000 evaluations from users of airline, hotel, OTA and rental car apps, between Dec-2018 and Jan-2019, will be formally launched in Nov-2019, and evaluates user satisfaction exploring the key variables that influence customer choice, satisfaction and loyalty. These are based on clarity of information provided; ease of navigation; overall appearance, speed of screens loading; and range of services/activities.
While this release of an initial preview of the study acknowledges that travel apps have "come a long way" and some are now "delivering on their promise" others are still "missing the mark at critical moments of truth". This means that they can significantly influence traveller perception of brands and services. "We see big swings in scores among travel apps when users evaluate searching and booking functions," says Michael Taylor, travel intelligence lead at J D Power.
CHART - JetBlue ranks highest in overall customer satisfaction among airline apps with a score of 864, followed by Southwest (861) and Alaska Airlines (849)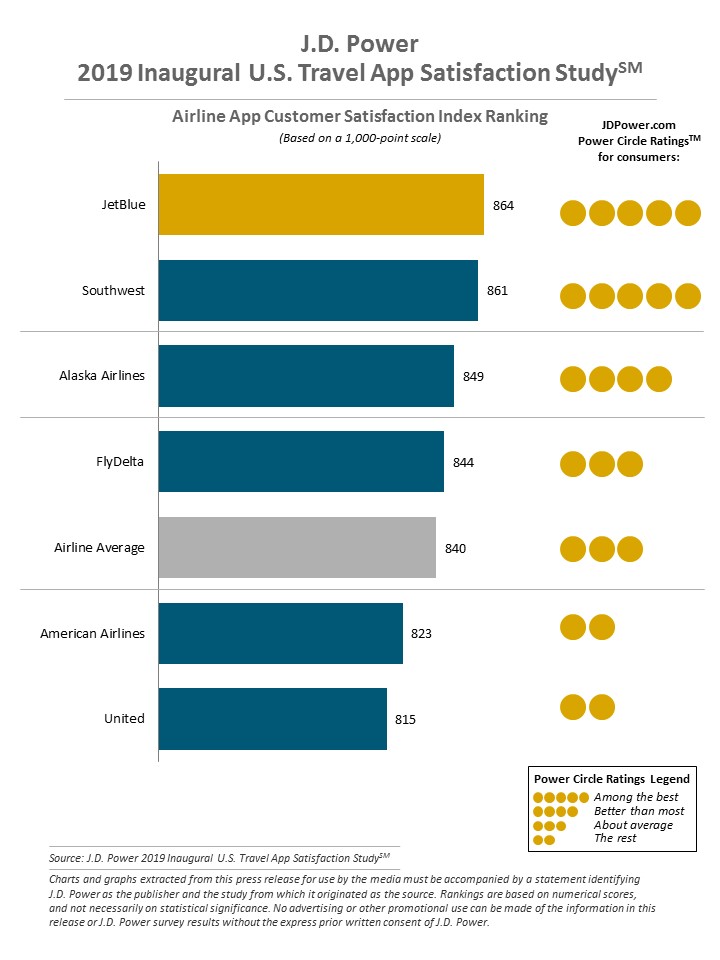 Source: US Travel App Satisfaction Study from J D Power
Most notably, the survey discovered travel apps lag far behind customer financial apps in overall satisfaction: The average overall satisfaction score for Hotel, OTA and Rental Car apps is 849 (on a 1,000-point scale). Airline apps score lower (840). By contrast, overall user satisfaction scores for credit card apps (874) and retail banking apps (867) are substantially higher. Both credit card and banking apps also have considerably higher levels of utilisation.
Day-of-travel performance is critical to travel app satisfaction: Across all segments of travel apps, the key performance indicator (KPI) J D Power associates with the most influence on overall satisfaction is ease of use during travel. Its findings show hotel apps that users cite as "easy to use" score 130 points higher in overall satisfaction compared with apps that are perceived as more difficult to use. Among airline apps, that gap is 125 points. However, just 58% of hotel apps and 62% of airline apps currently achieve these levels.
CHART - World of Hyatt ranks highest in overall customer satisfaction among hotel apps with a score of 867, followed by IHG (855) and Hilton Honors (853)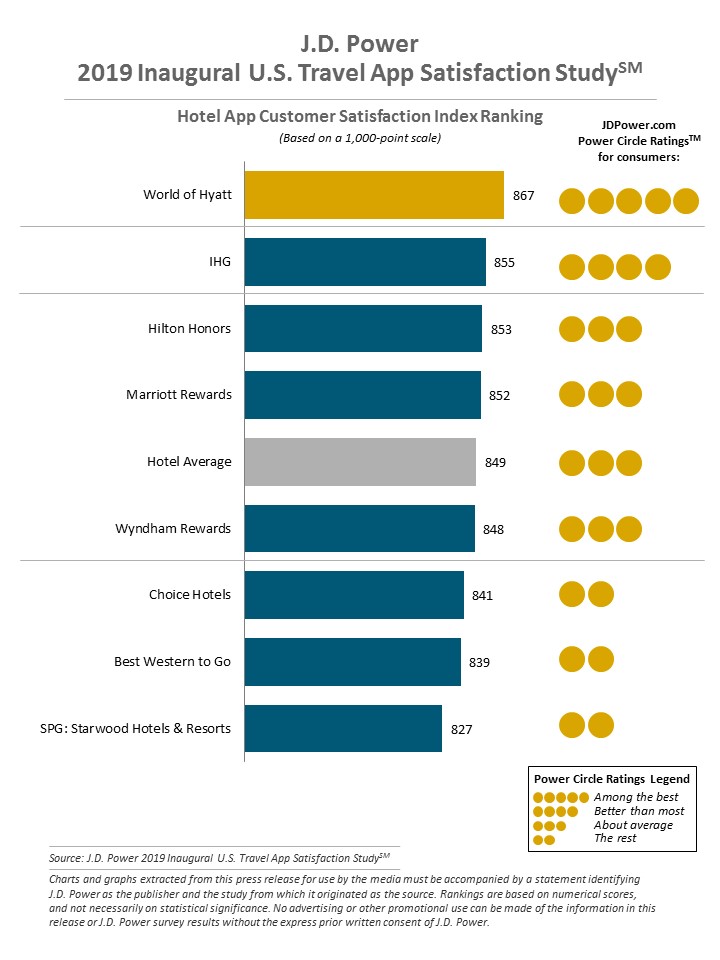 Source: US Travel App Satisfaction Study from J D Power
Within the travel space airline apps have the highest levels of customer utilisation of critical features during the day of travel, but the lowest performance in the industry when it comes to speed of screens loading during travel, according to the evaluation responses. OTAs perform best on this metric, with an average page load speed satisfaction score of 856. The average score for airline apps is 824.
Meanwhile, rental car apps have lowest rate of adoption in travel industry: Among app users that indicated they have a travel app already downloaded on their smartphone, airline apps lead the industry in customer adoption rate at 90%, according to the findings. They are followed by hotel apps (84%); OTA apps (78%); and rental car apps (59%).