The Blue Swan Daily, in partnership with MIDAS Aviation, across this week will deliver the findings into an analysis of the world's 'Top 100' airports by capacity, highlighting differences in airport approaches to route development, passenger profile trends between different destinations, those airports that have the most reliance upon a single airline partner and those that have the biggest diversity of airline partners.
Today, we focus on Asia and Australasia and look at which of the world's 'Top 100' airports have the largest and smallest percentage shares from their dominant airline partner.

As we reported yesterday, our analysis of OAG schedule data for the current summer 2017 schedule at the world's 'Top 100' airports by departure shows that Osaka Kansai International in Japan has the least dominant leading airline at the facility with Peach Aviation holding just a 12.1% share of the airport's departure seats. It is one of 70 airlines that have served the airport this summer.
It would appear that China and Japan have the most open strategy to airline partnerships across Asia and Australasia with airports across the two countries accounting for eight of the 'Top 10' with the lowest dominant airline shares. The exceptions being Denpasar Ngurah Rai International Airport in Bali, Thailand (Garuda Indonesia - 20.6%) and Delhi Indira Gandhi International Airport in India (IndiGo - 25.9%), the largest of the ten airports featured.
The Chinese examples comprise Chongqing Jiangbei International Airport (Air China - 13.5%), Hangzhou Xiaoshan International Airport (Air China - 15.7%), Zhengzhou Xinzheng International Airport (China Southern Airlines - 22.8%) and Nanjing Lukou International Airport (China Eastern Airlines - 24.7%). Alongside Osaka, Tokyo Narita International (Japan Airlines - 12.9%), Fukuoka Airport (All Nippon Airways - 20.9%) and Sapporo New Chitose Airport (All Nippon Airways - 25.9%) make up the Japanese contingent.
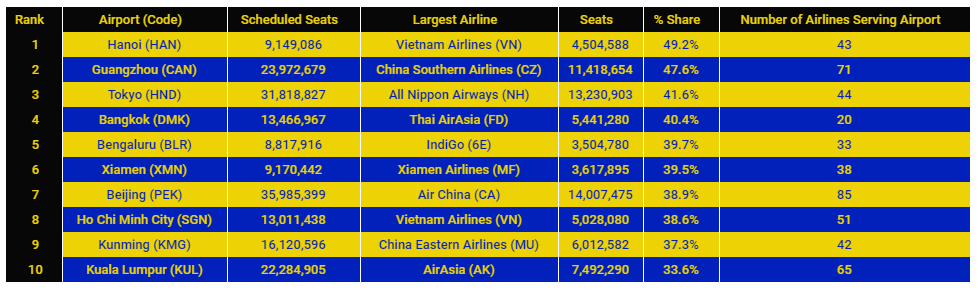
At the other end of the scale, Vietnam appears a nation that still relies on its national carrier, Vietnam Airlines, with both Ho Chi Minh City Tan Son Nhat International Airport and Hanoi Noi Bai International Airport, the two largest gateways into the country among the 'Top 10' facilities in Asia and Australasia ranked by largest dominant airline share. SkyTeam alliance member holds a 38.6% share of departure capacity out of Ho Chi Minh City and a 49.2% share out of Hanoi, which tops the ranking.
The analysis also highlights how China Southern Airlines holds the strongest position at its Guangzhou Baiyun International Airport, with its 47.6% capacity share higher than that of Air China out of Beijing Capital International Airport (38.9%) and China Eastern Airlines at Shanghai PuDong International Airport (26.5%).
Interestingly, the rise of the Low Cost Carriers (LCCs) across the region is evident with Thai AirAsia the largest operator at Bangkok Don Mueang International (40.4%) among a network of just 20 operators, IndiGo the largest carrier at Bengaluru Kempegowda International Airport (39.7%) and most notably AirAsia at Kuala Lumpur International Airport (33.6%) one of the main hub airports in the region.
None of the South Pacific's airports made it into either of the 'Top 10' reports. The region's three airports within the world's 'Top 100' by capacity sat nicely in the middle of the analysis with Qantas the dominant carrier out of Sydney Kingsford Smith Airport and Melbourne Airport (with 28.9% and 27.7% departure capacity shares) and Virgin Australia dominant out of Brisbane with a slightly larger share of capacity (30.6%).
CHART - Historical slot restrictions have enabled All NIppon Airways (ANA) to develop a strong position at Tokyo Haneda International Airport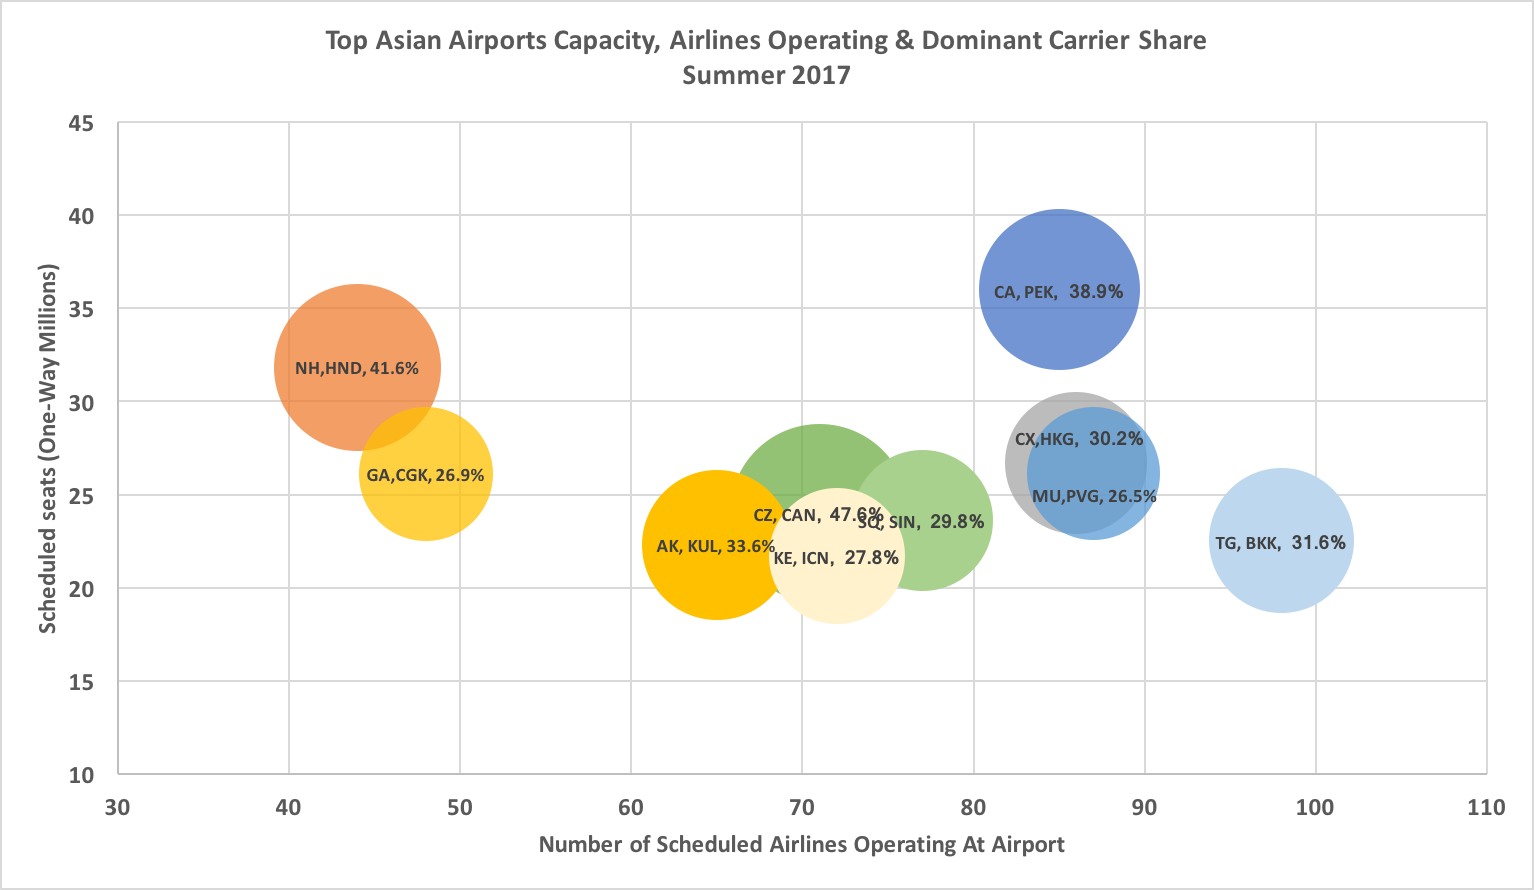 Source: The Blue Swan Daily, MIDAS Aviation and OAG
When the number of scheduled seats, the number of scheduled airlines and the percentage share of the dominant carrier are plotted on a graph in clearly illustrates some key trends and differences between the ten largest airports across Asia and Australasia.
It is clear that the historical slots restrictions have enabled All Nippon Airways (NH) to develop a dominant position at Haneda International Airport, increasingly the preferred gateway for travellers to Tokyo due to its closer proximity to the city. The airline this summer still holds a 41.6% share of departure capacity and is one of just 44 airlines present there - significantly less than the operator count at the region's other largest airports.
As highlighted above, the three major Chinese airports have a very different composition of flights across the three main gateways with China Southern Airlines holding the strongest share (41.6%) at Gungzhou Baiyun International Airport where it is one of 71 carriers. Meanwhile, Air China has a 38.9% share at Beijing Capital International Airport among 85 airlines and China Eastern Airlines a 26.5% share at Shanghai PuDong International Airport among 87 airlines.
READ THE PREVIOUS STORY IN THIS SERIES...
https://corporatetravelcommunity.com/insight-osaka-kansai-tokyo-narita-manchester-and-los-angeles-among-major-global-airports-offering-strongest-airline-variety/
** TOMORROW: In Part 3 we look more closely at airports across the Americas with a focus on the major North American hubs **