Now, with three months in a row where construction numbers either decreased or remained flat, STR's senior vice president of lodging insights, Jan Freitag, says "we feel we can now call that a trend".A construction decline obviously bodes well for the current industry cycle. "It appears that financing is becoming harder to obtain," explains Ms Freitag as the reason for the shift. "If demand growth holds, occupancy will not deteriorate as quickly or as much as anticipated," she adds.
According to STR's pipeline data, New York, New York, remains the construction leader in the US with 12,074 rooms being built across 69 hotels. Two additional major city destinations (among STR's top 25 Markets) reported more than 5,000 rooms in construction: Dallas, Texas with 5,768 rooms in 45 hotels and Nashville, Tennessee with 5,028 rooms across 33 hotels. Of those three markets, only Nashville showed more construction activity than this time last year, up +47.8%.
CHART - After entering 2017 with year over year monthly growth of more than 25%, it is suggested that the future pipeline for US hotels is starting to decline, a position clear visible in this graphic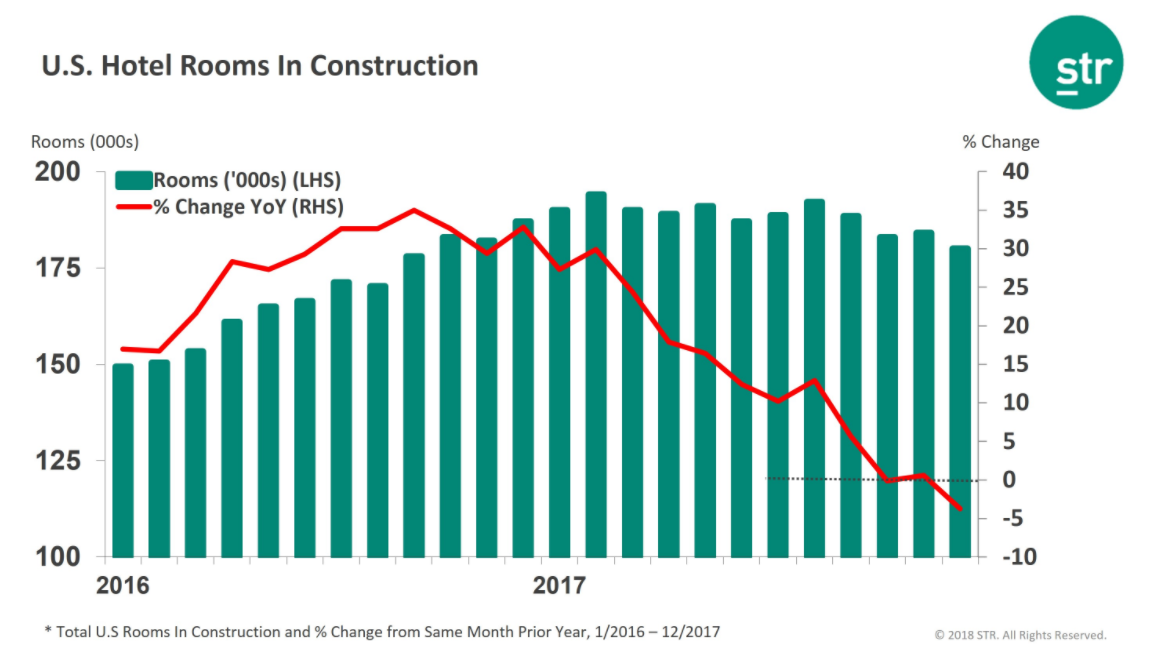 Source: STR
Additional data from STR shows the US hotel industry reported positive year over year results in the three key performance metrics during the first week of 2018. However, the data is skewed by the fact this year's figures include New Year's Eve data covering the period 31-Dec-2017 to 06-Jan-2018. This helped boost occupancy levels +3.6% to 48.7%, average daily room rate (ADR) +5.8% to USD124.33 and revenue per available room (RevPAR) +9.6% to USD60.59. This compares with the 01-Jan-2017 to 07-Jan-2017 period.
Although we can't necessarily read anything from the comparison, we can see which city markets are performing the strongest. Among the top 25 markets, the top RevPAR increases were reported in Orlando, Florida (+36.7% to USD116.34), and New Orleans, Louisiana (+35.0% to USD110.50), according to the STR data, while New York, New York, posted the largest lift in ADR (+23.8% to USD222.68) and delivered the third-largest jump in RevPAR (+34.0% to USD171.41).
Elsewhere, San Diego, California, experienced the highest rise in occupancy (+19.4% to 62.9%) with RevPAR in the market growing 31.4% to USD79.95. Overall, 17 of the top 25 markets reported double-digit increases in RevPAR, but this was again likely driven by the New Year's Eve anomaly which helped grow RevPAR 84.1% and 16.1% across the first two days of the week (Sunday and Monday) with year over year declines being reported for the rest of the week.
Tampa/St. Petersburg, Florida, reported the largest decrease in ADR (-6.1% to USD124.60) and the only decline in RevPAR (-5.5% to USD78.28), reports STR, while the only two drops in occupancy were seen in Denver, Colorado (-0.9% to 49.7%), and St Louis, Missouri (-0.8% to 42.2%).