It had a been a bright start to the year for Brazil's main international gateway with strong domestic traffic growth being recorded in the first two months of the year. In Feb-2020, passenger numbers were up +6.1% year-on-year thanks to a +12.1% growth in domestic traffic.
Alongside this performance the airport formally handed over documentation to the Brazilian regulator, ANAC, for the construction of a people mover system to connect it to the Sao Paulo City rail network.
Things are very different now. At this time it should have been making preparations for the launch of a new non-stop link to London from Virgin Atlantic Airways, but that has understandably now been deferred until Oct-2020. Instead it is temporarily unifying all operations at Terminal 3 given the reduction in services it is now seeing.
ABOUT
GRU Airport Sao Paulo Guarulhos International Airport is the busiest airport in Brazil and the country's main international gateway, serving Brazil's commercial centre and biggest city São Paulo. Guarulhos is a hub for Avianca Brazil, TAM Airlines and Gol, with Azul and regional Brazilian carriers also maintaining a heavy presence. The airport is served by all major North American and Latin American carriers, as well as a large number of European flag carriers. A number of African and Gulf carriers also serve Guarulhos, while Asian carriers such as Air China, Korean Air and Singapore Airlines serve Guarulhos via the US and Europe.
GLOBAL RANKING (as at 23-Mar-2020)
NETWORK MAP (as at 23-Mar-2020)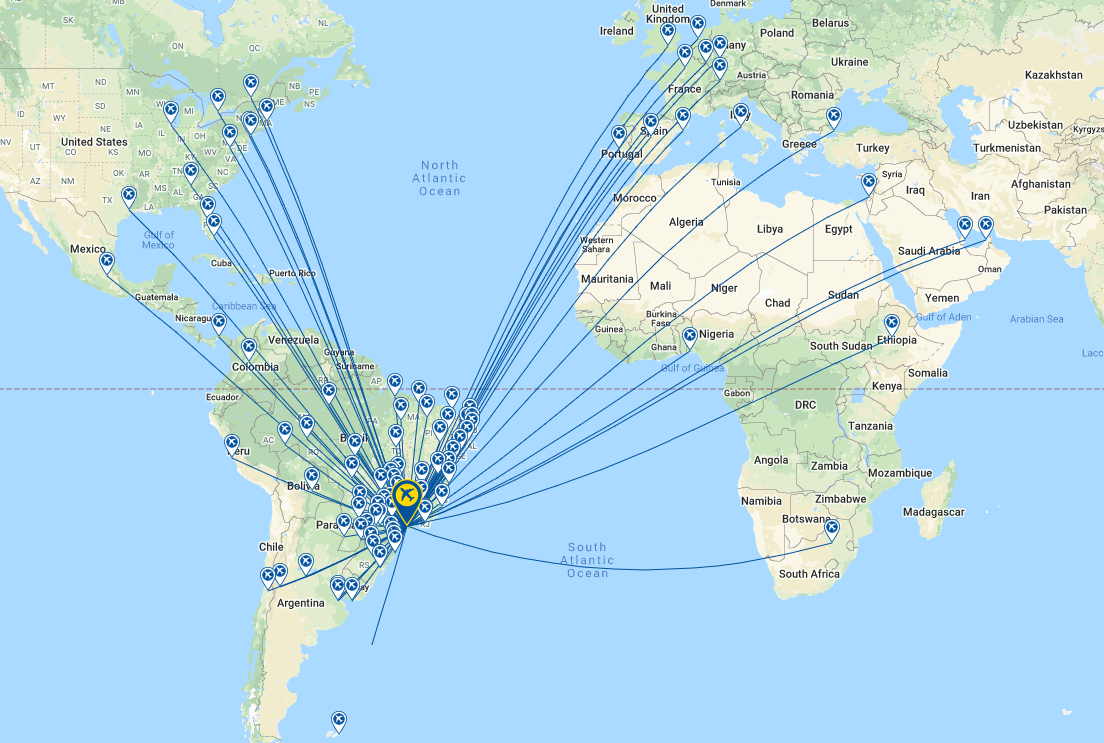
DESTINATIONS (as at 23-Mar-2020)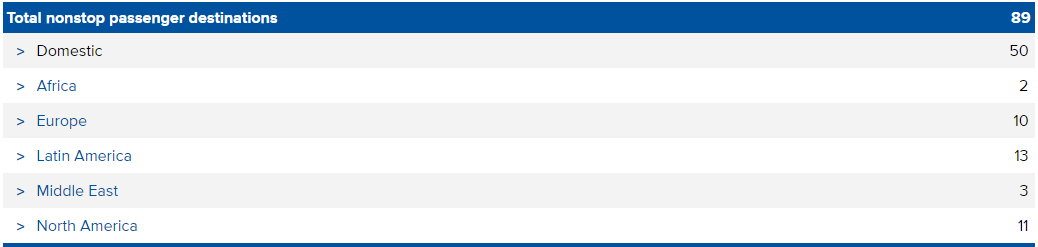
ANNUAL PASSENGER TRAFFIC (2010 - 2020YTD)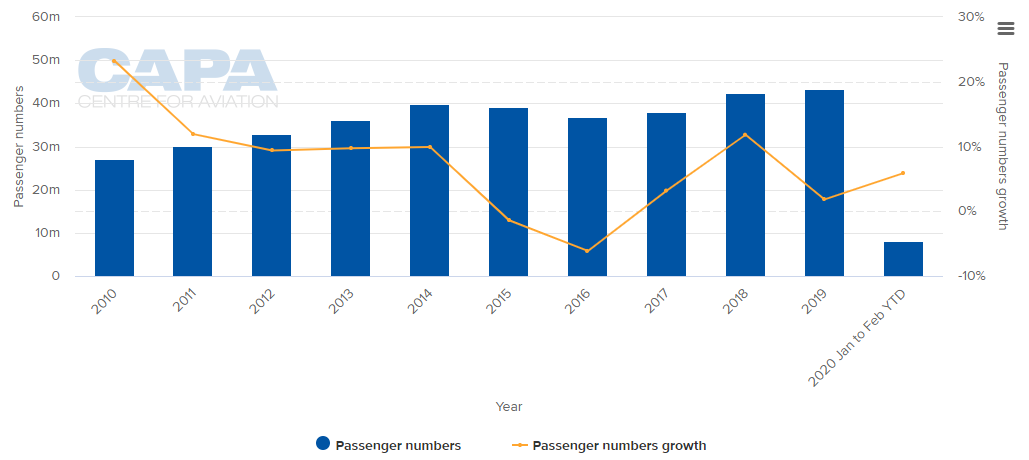
MONTHLY PASSENGER TRAFFIC AND SEASONALITY IN DEMAND (2015 - 2020YTD)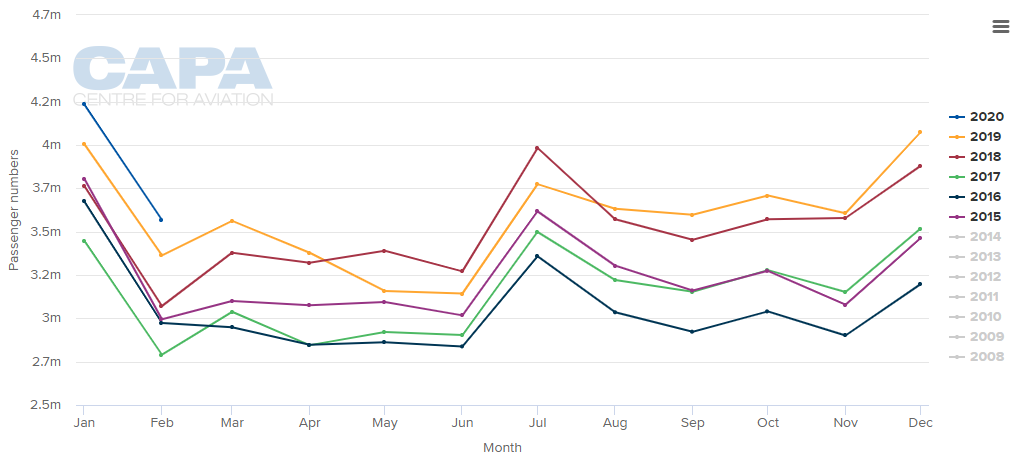
ANNUAL CAPACITY (2012-2020*)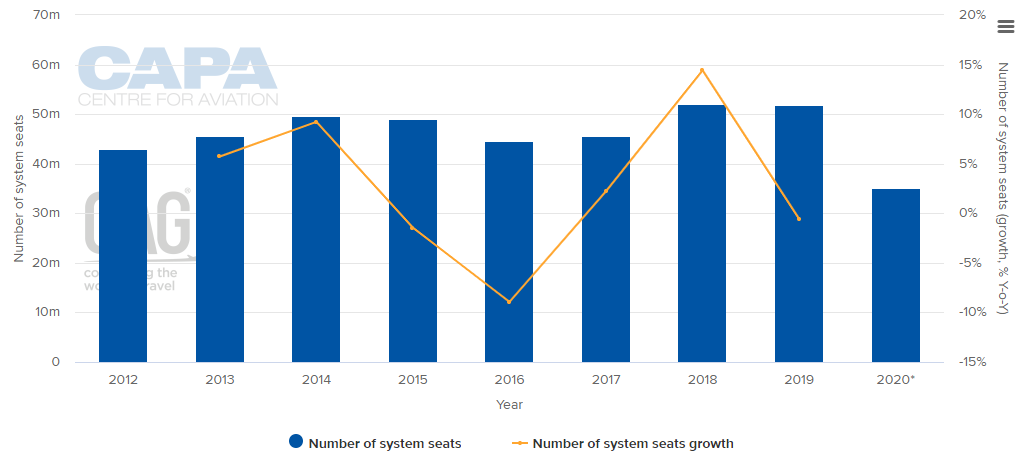 (NOTE:The values for this year are at least partly predictive up to 6 months and may be subject to change)
WEEKLY DOMESTIC CAPACITY (2017 - 2020*)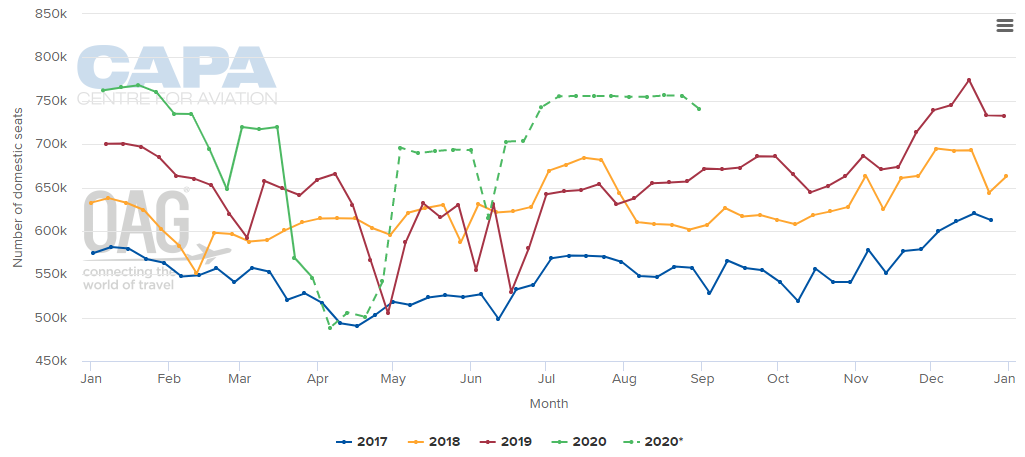 NOTE:*the values for this year are at least partly predictive up to six months and may be subject to change.
WEEKLY INTERNATIONAL CAPACITY (2017-2020*)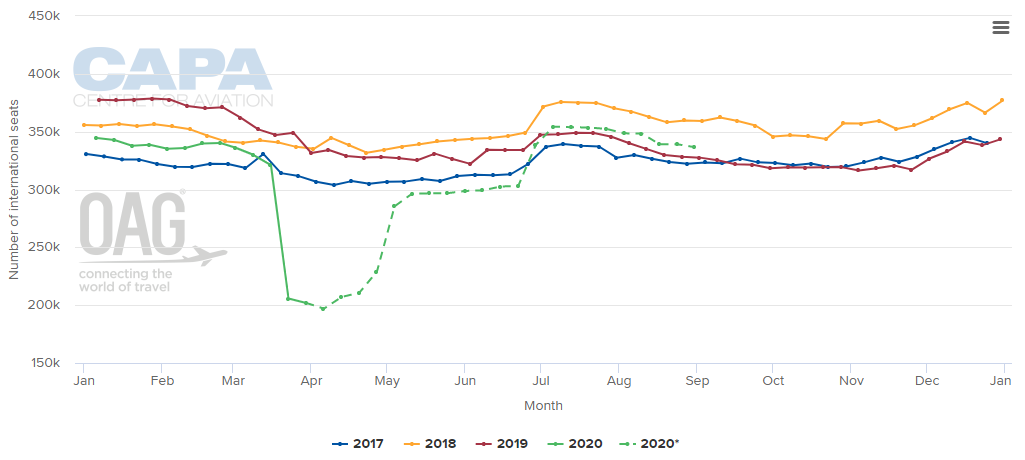 NOTE:*the values for this year are at least partly predictive up to six months and may be subject to change.
CAPACITY SPLIT BETWEEN DOMESTIC AND INTERNATIONAL OPERATIONS (w/c 23-Mar-2020)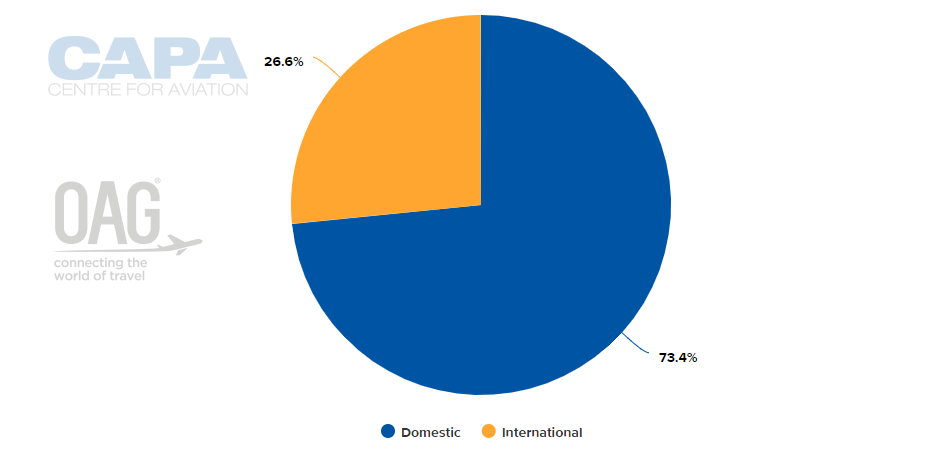
LARGEST AIRLINES BY CAPACITY (w/c 23-Mar-2020)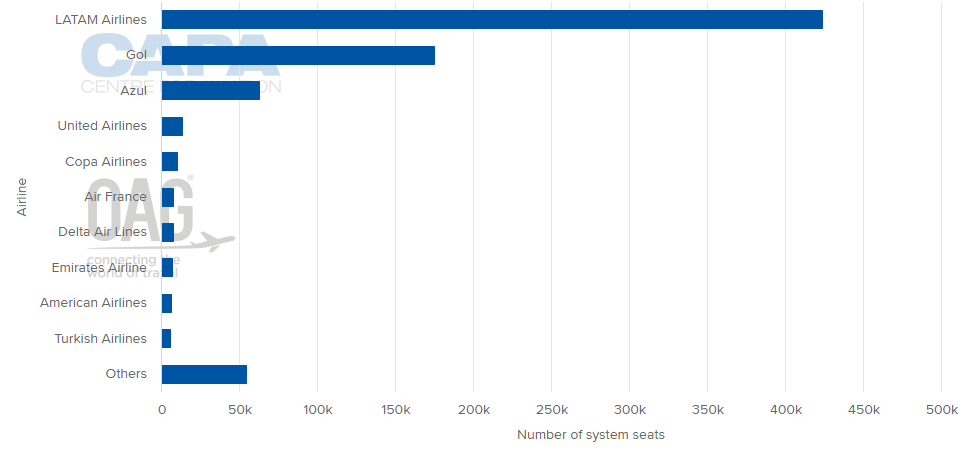
LARGEST DOMESTIC DESTINATION MARKETS (w/c 23-Mar-2020)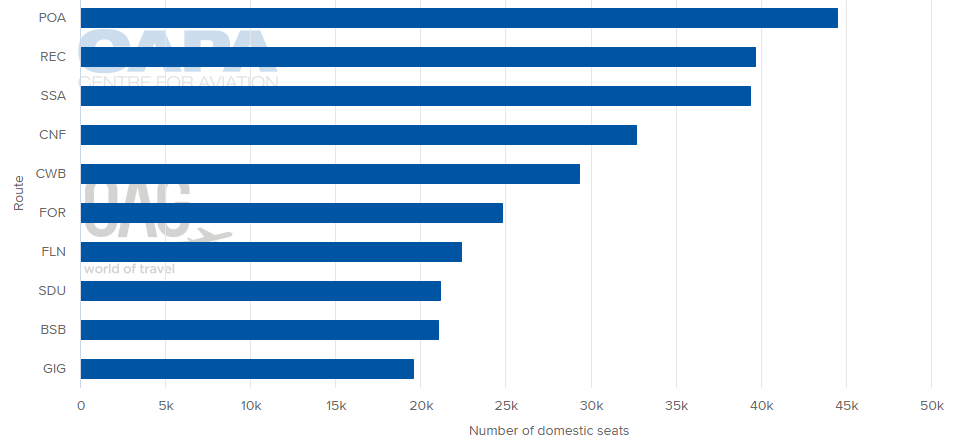
LARGEST INTERNATIONAL DESTINATION MARKETS (w/c 23-Mar-2020)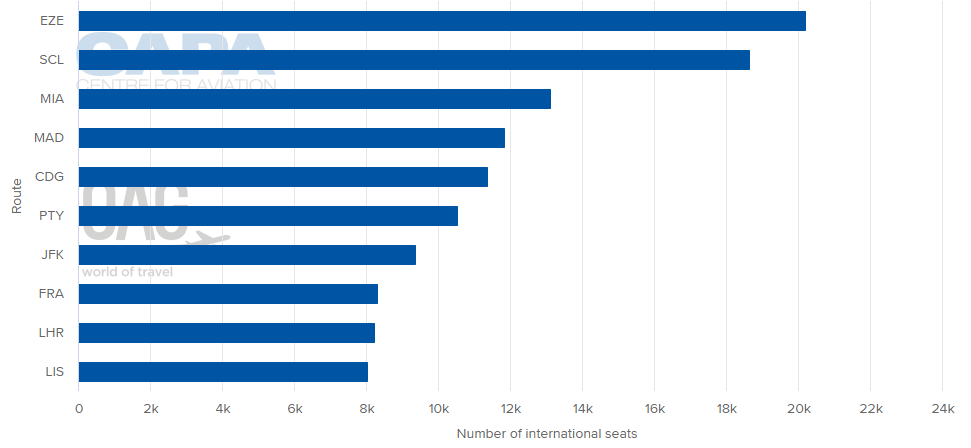
AVERAGE FLIGHT LENGTH (w/c 23-Mar-2020)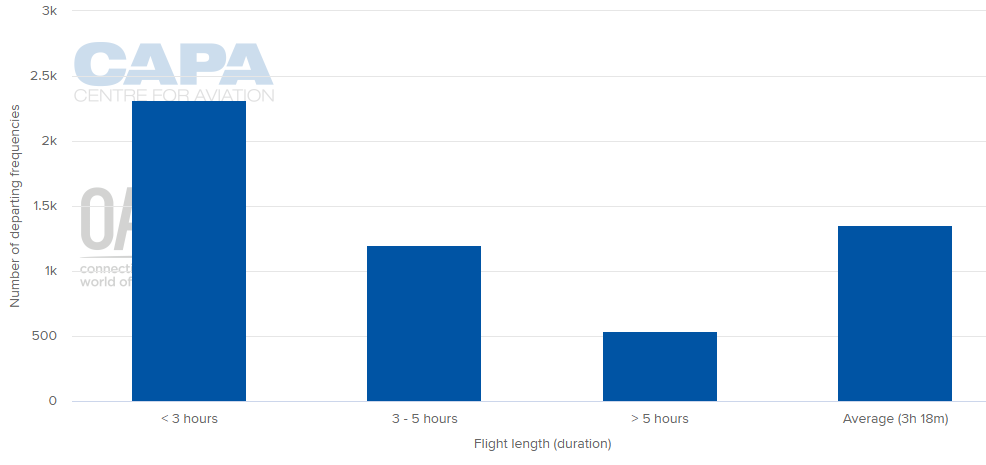
AIRLINE BUSINESS MODEL CAPACITY SPLIT (w/c 23-Mar-2020)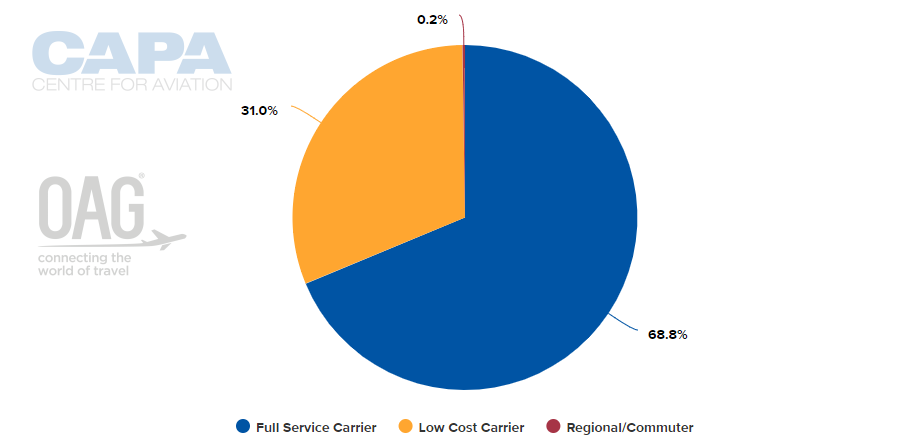
ALLIANCE CAPACITY SPLIT (w/c 23-Mar-2020)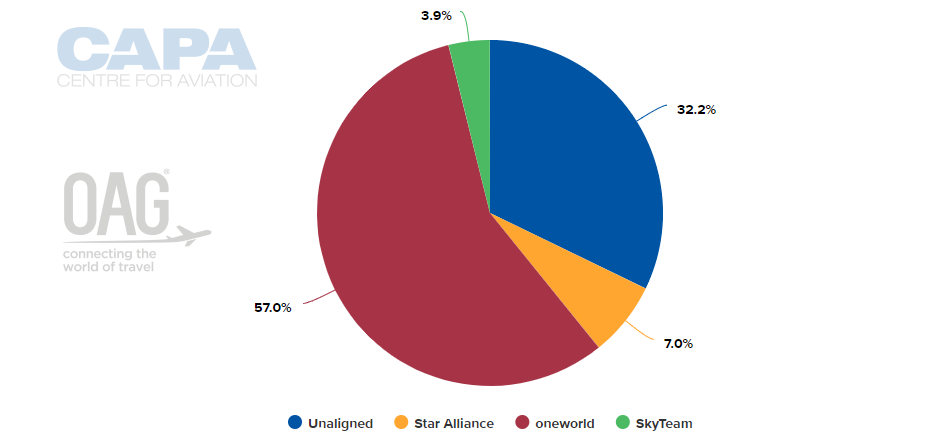
INTERNATIONAL MARKET CAPACITY BREAKDOWN BY REGION (w/c 23-Mar-2020)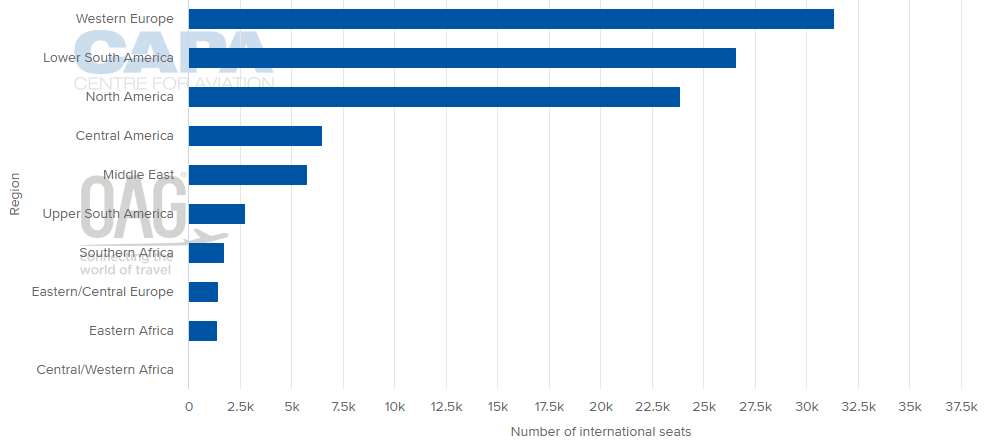
AIRCRAFT OPERATIONS BY MOVEMENTS (w/c 23-Mar-2020)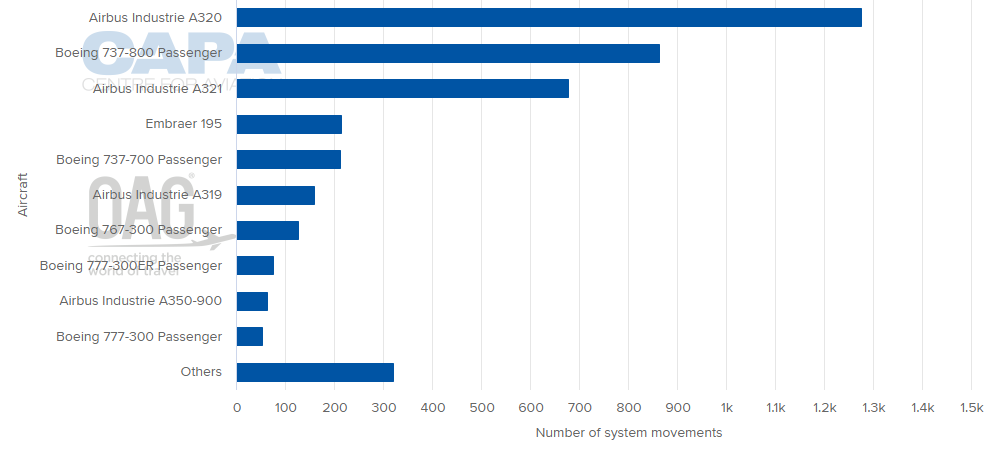
MORE INSIGHTS...
UK to South America aviation: Virgin Atlantic enters with 787s
US-to-Latin America aviation: JVs and LCCs change the dynamics
Brazilian aviation: airlines face fast moving changes in early 2019