The Australian bushfires have been dominating world news and this week started to have a significant impact on air travel into Melbourne. On 15-Jan-2010 bad weather, including smoke haze from the Australia bushfires was blamed for the cancellation of numerous services at Melbourne's Tullamarine airport. Australia is battling its worst bushfire season on record, with fires burning since Sep-2019 having tragically killed 29 people, wildlife and destroyed more than 2,500 homes.
ABOUT
Melbourne Tullamarine airport is the main gateway to Melbourne, Victoria. Owned and operated by Australian Pacific Airports Corporation Ltd and the second-largest airport in Australia, it hosts domestic and international passenger and cargo services for over 25 airlines and is a hub for Qantas Airways, Jetstar Airways, Tigerair Australia and Virgin Australia.
GLOBAL RANKING (as at 13-Jan-2020)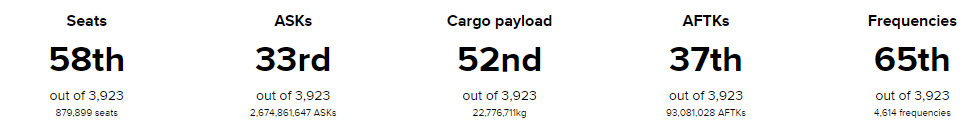
NETWORK MAP (as at 13-Jan-2020)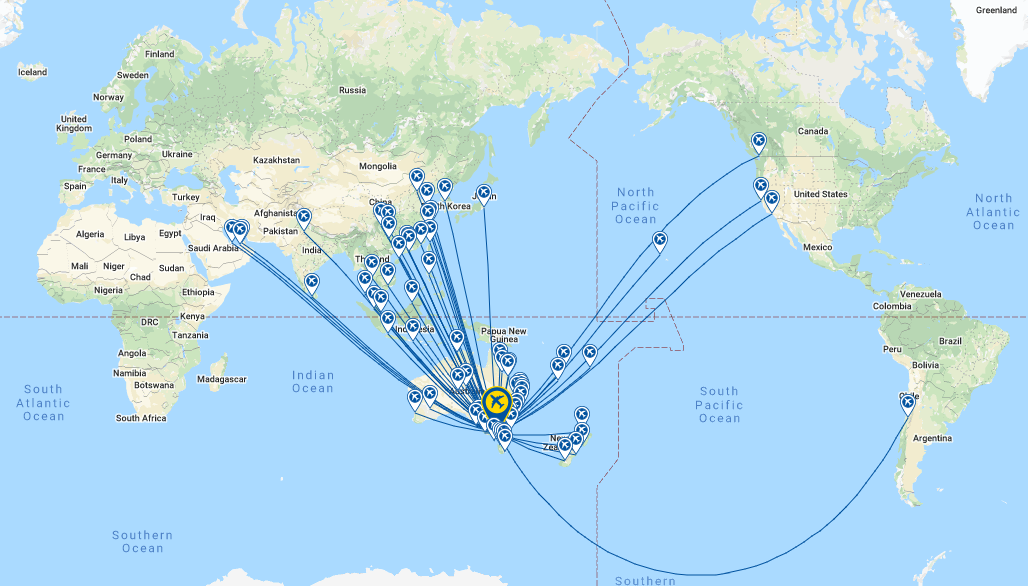
DESTINATIONS (as at 13-Jan-2020)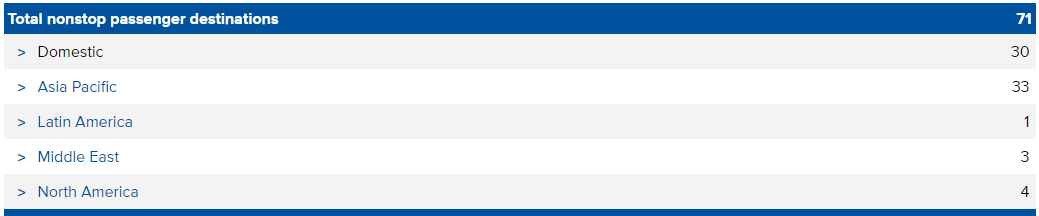
ANNUAL PASSENGER TRAFFIC (2010 - 2019)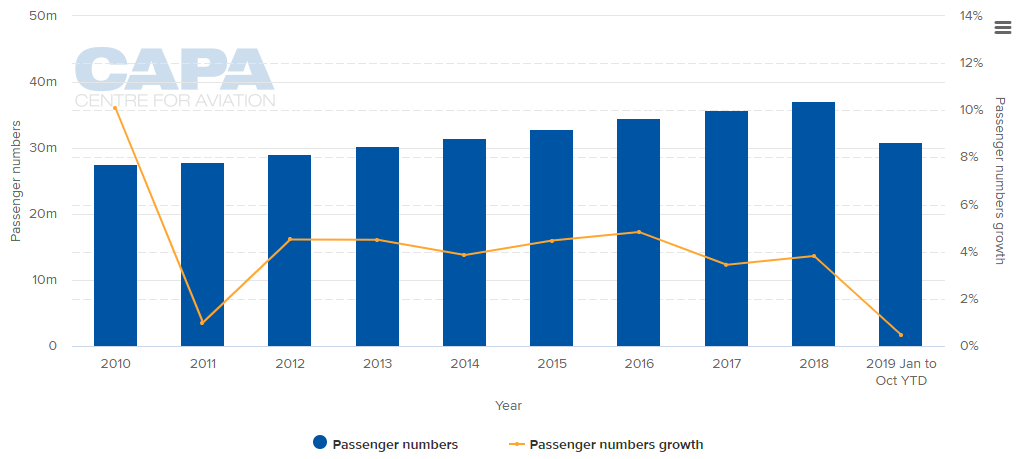
MONTHLY PASSENGER TRAFFIC AND SEASONALITY IN DEMAND (2014 - 2019)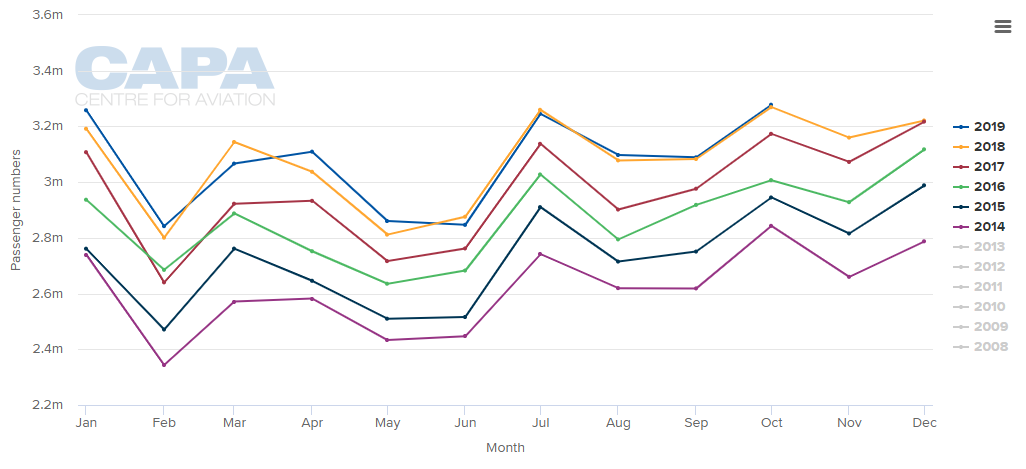
ANNUAL CAPACITY (2012-2020*)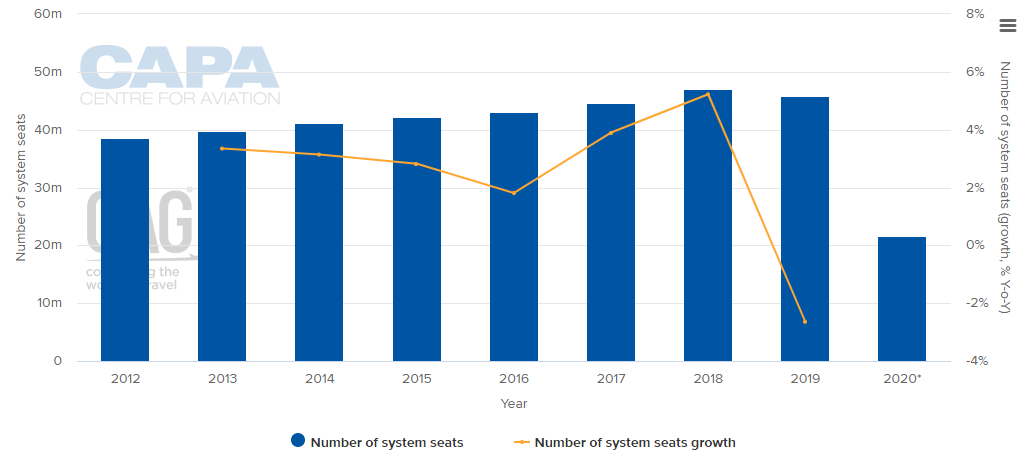 (NOTE:The values for this year are at least partly predictive up to 6 months and may be subject to change)
CAPACITY SPLIT BETWEEN DOMESTIC AND INTERNATIONAL OPERATIONS (w/c 06-Jan-2020)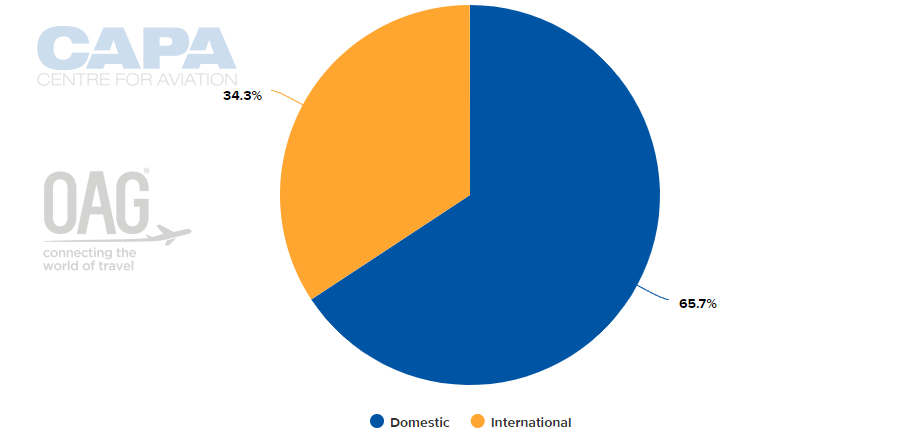
LARGEST AIRLINES BY CAPACITY (w/c 13-Jan-2020)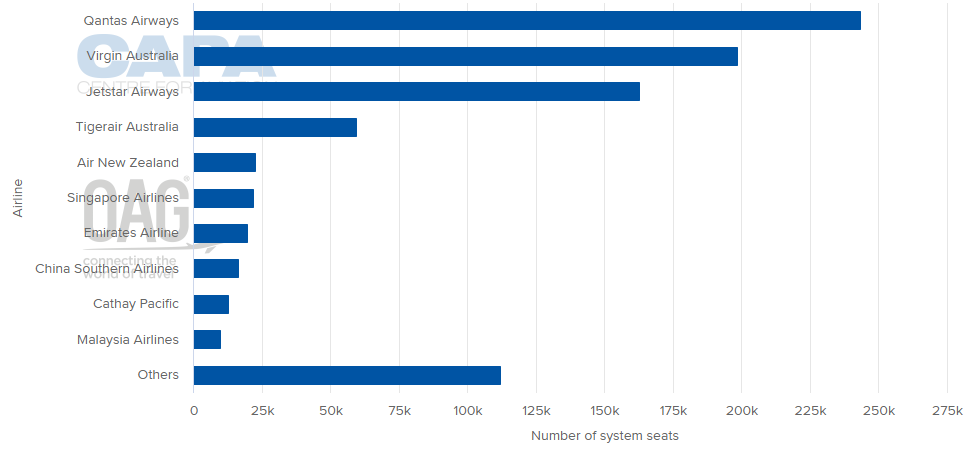
LARGEST DOMESTIC DESTINATION MARKETS (w/c 13-Jan-2020)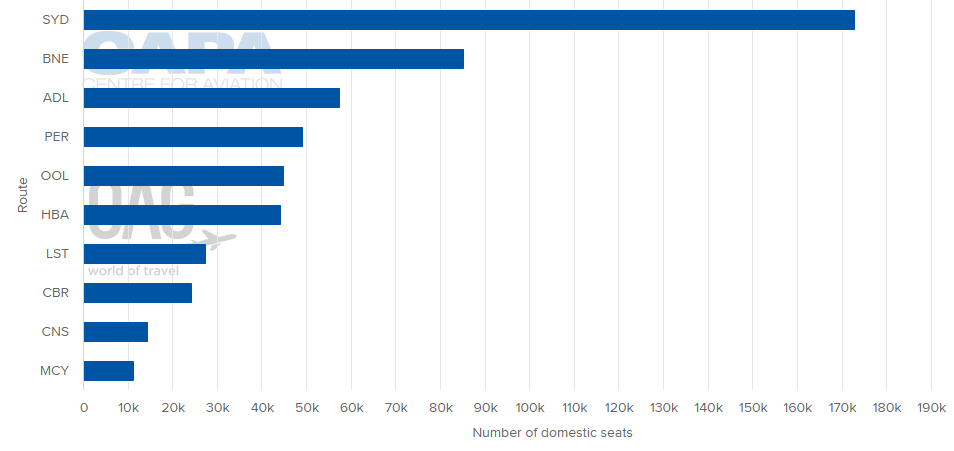
LARGEST INTERNATIONAL DESTINATION MARKETS (w/c 13-Jan-2020)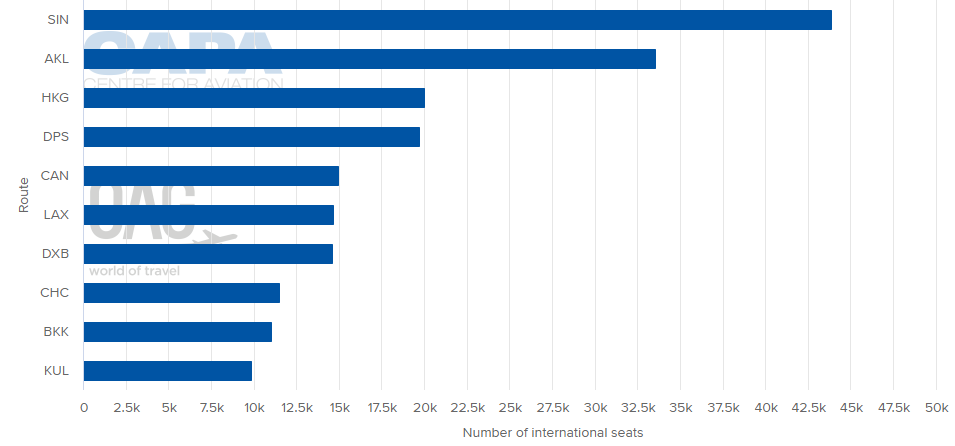
AVERAGE FLIGHT LENGTH (w/c 13-Jan-2020)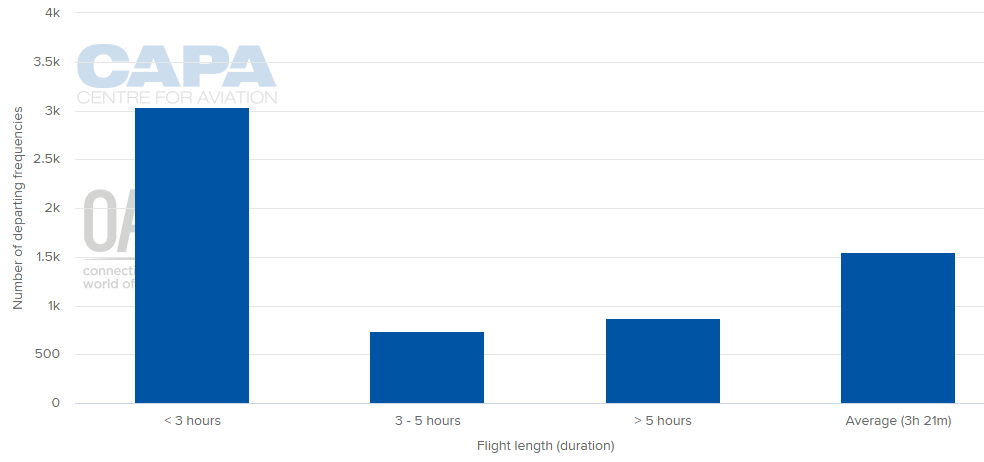
AIRLINE BUSINESS MODEL CAPACITY SPLIT (w/c 13-Jan-2020)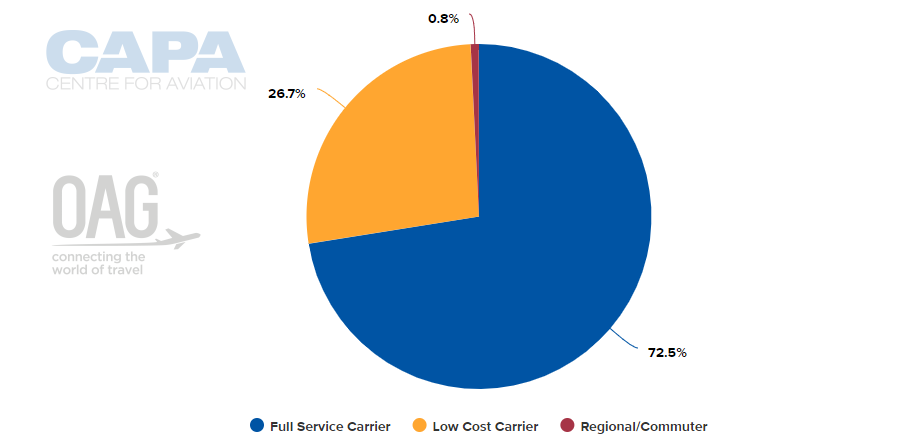
ALLIANCE CAPACITY SPLIT (w/c 13-Jan-2020)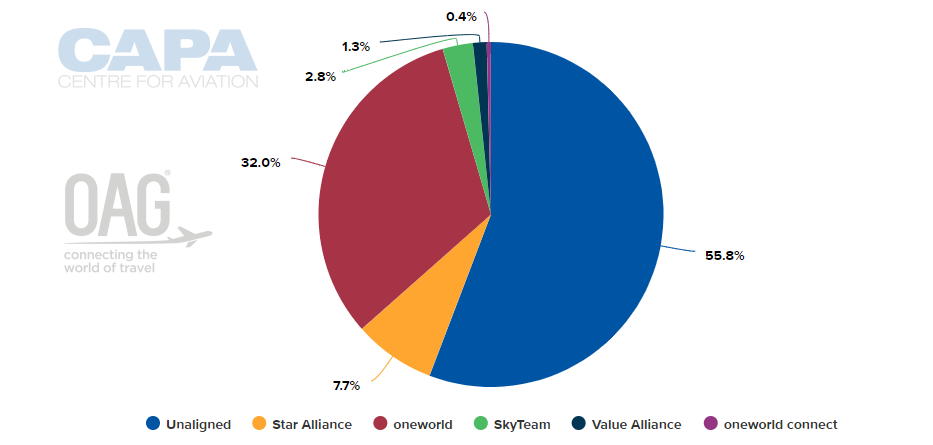
INTERNATIONAL MARKET CAPACITY BREAKDOWN BY REGION (w/c 13-Jan-2020)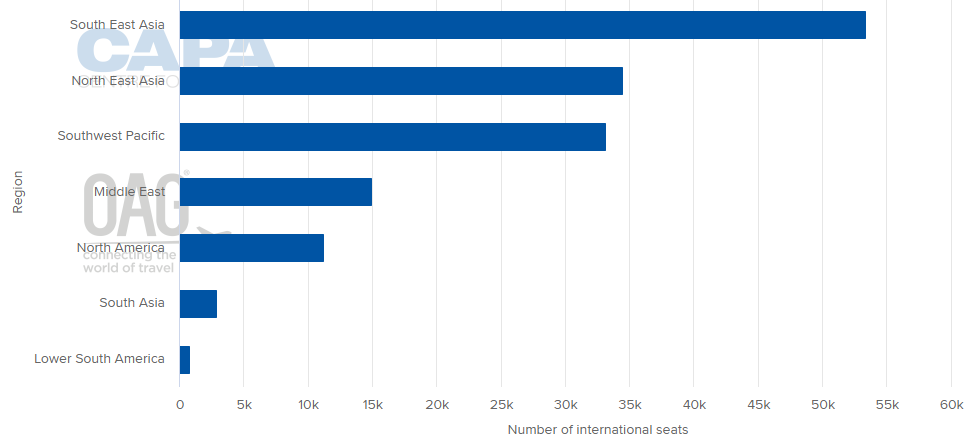
AIRCRAFT OPERATIONS BY MOVEMENTS (w/c 13-Jan-2020)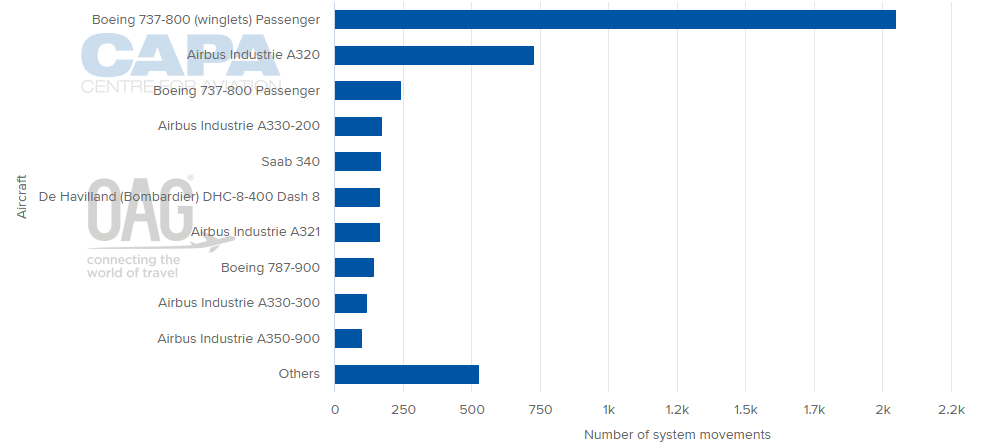
SYSTEM CARGO PAYLOAD (2013 - 2020*)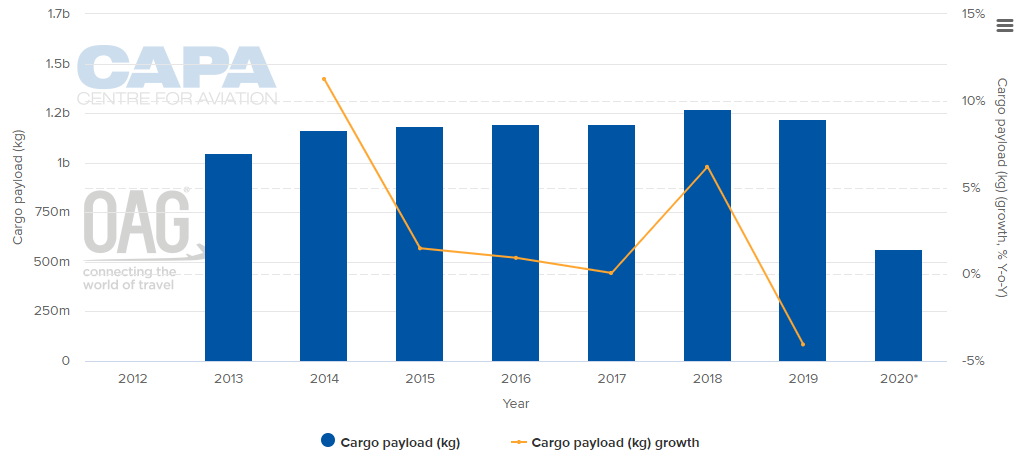 (NOTE: The values for this year are at least partly predictive up to 6 months and may be subject to change)
MORE INSIGHT...
Melbourne Tullamarine Airport's extraordinary decade of growth