Well, that seems to be exactly the case. The latest The Blue Swan Daily analysis of OAG flight schedules for this week shows that the total number of flights scheduled to operate during the week commencing 27-Apr-2020 is just under 248,000, up from just over 242,000. It may be less than 6,000 flights, and less than a +2.5% rise, but it suggests global flight frequencies may have hit their inflection point.
While we may still see some reductions in certain parts of the world, growth in many of the markets that are now emerging at the other side of the Covid-19 pandemic should more than cover those cuts. But, we can't get too excited as it is far too early to start talking about recovery.
We are at the bottom of the cycle right now and many predict it could be a tough climb. Each step up could be met with a subsequent slide down as airlines balance capacity with demand. The expression: "two steps forward, one step back" comes to mind, others define it as "a bumpy path" to the 'new normal'.
When compared to the flight schedules filed by airlines as at the start of this year, the number of one-way flights removed by airlines during the week commencing 27-Apr-2020 is just under 445,000 departures (in fact it is exactly 444,444), a -64.2% reduction, another positive movement versus last week when 452,000 departures were removed, a -65.1% reduction.
CHART - The reduction in the number of weekly flight departures from each of the 20 largest aviation markets in the world at the start of this year remains significant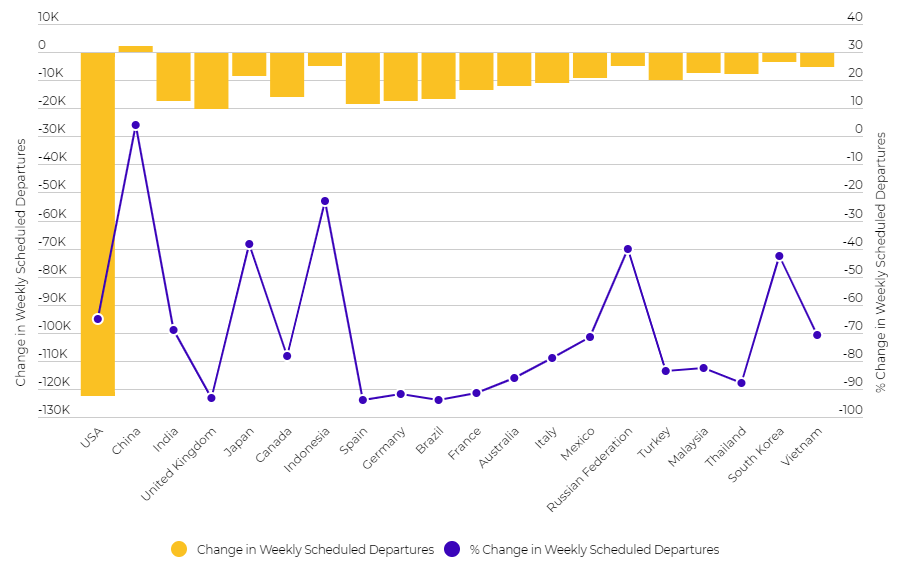 Source: The Blue Swan Daily and OAG (data: 28-Apr-2020)
There are a couple of positive standouts from the above chart. Firstly, and most noticeably is that the schedules are suggesting that there are more flights operating in China than had been planned for the current week at the start of the year. Secondly, the number of countries with schedules more than -90% below their planned operation has reduced.
As we have highlighted previously, this powerful metric is now diluting in value as we progress through the year. It is now over four months since the benchmark date and across parts of the world some airlines only publish full schedules up to three months ahead.
We continue to closely monitor China and especially its significant domestic market. The country is currently fearful of a second phase of Covid-19 infections and a cluster of cases in the north-eastern city of Harbin has forced authorities to impose new lockdowns.
The data shows that Apr-2020 has been a mixed month with domestic capacity being adjusted up and down, but ends with the highest number of domestic seats planned for almost three months since the week commencing 03-Feb-2020 when the global spread of coronavirus was still in its infancy.
CHART - Growth in domestic capacity in China remains fairly flat but levels have inched up this week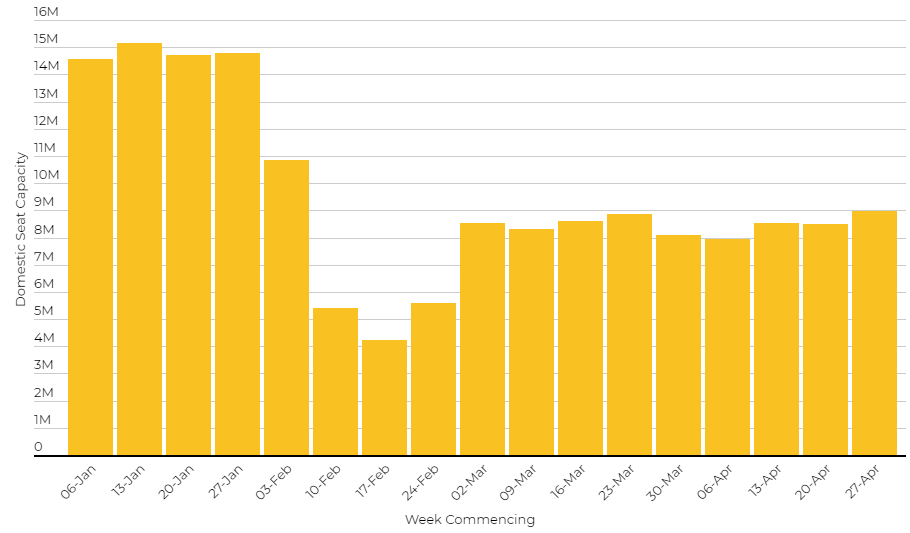 Source: The Blue Swan Daily and OAG (data: 28-Apr-2020)
China's network growth has coincided with the latest cuts among US carriers and this continues to put the country on the top of the world - in terms of air capacity, at least. This position has now been held for three successive weeks and the gap has widened further this week with China's capacity up +6.0% on last week and USA's down a further -5.5%. This is a ten point wing, but the low base means it is only a ripple when compared to the 'normal' schedules of the two countries
CHART - It has come four years earlier than anticipated and is likely only temporary, but China is currently the world's largest aviation market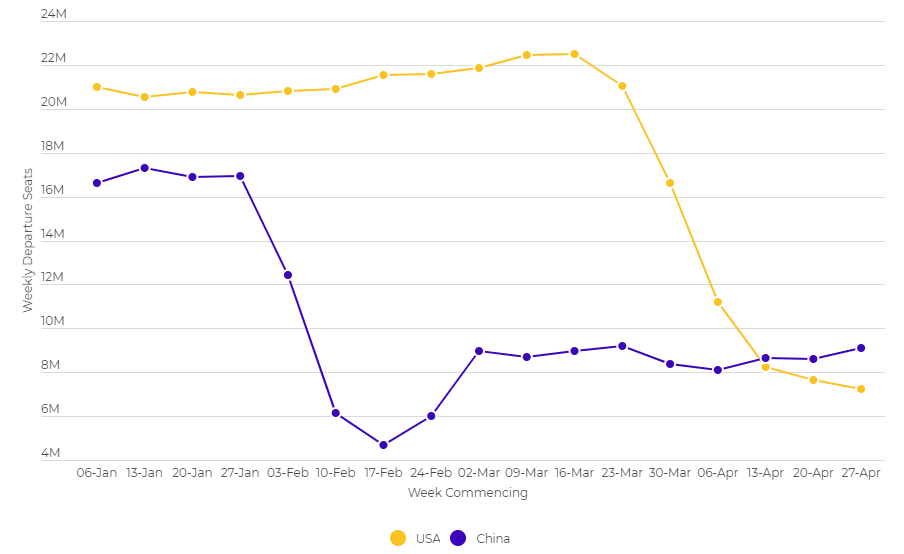 Source: The Blue Swan Daily and OAG (data: 28-Apr-2020)
The year had started positively for global air transport. Across the first three weeks capacity levels were up year-on-year, albeit a declining trend was already evident. For the week commencing 06-Jan-2020 capacity was up +3.5%, followed in week commencing 13-Jan-2020 by +3.4%, then +2.5% for week commencing 20-Jan-2020 and then +2.0% for week commencing 27-Jan-2020.
Last week, we saw the year-on-year capacity pass the -70% mark for the first time, falling -71.7%. This week's +4.7% rise in capacity versus the week commencing 20-Apr-2020 has not yet put us on the right side of that -70% figure with year-on-year capacity down -70.4% on the same week last year.
CHART - Global air capacity has collapsed as the Covid-19 pandemic has spread across the world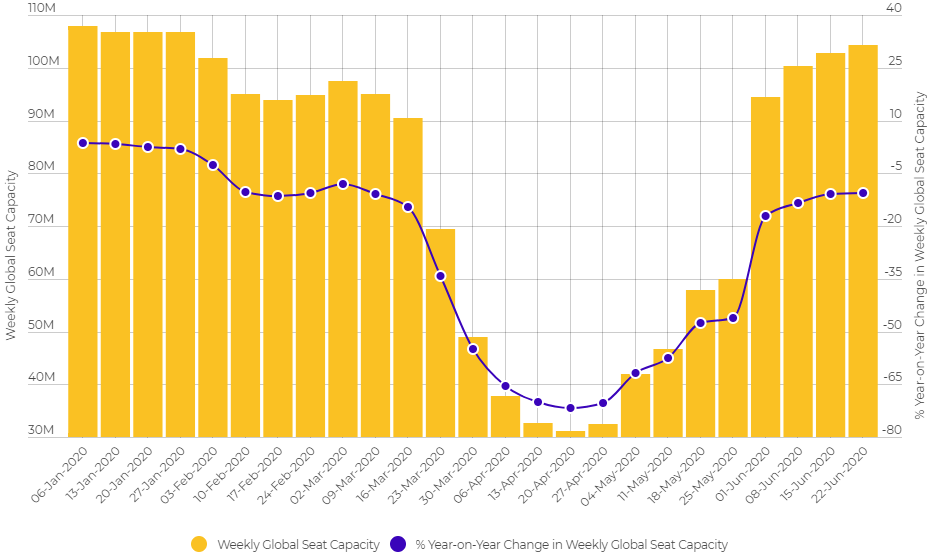 Source: The Blue Swan Daily and OAG (data: 28-Apr-2020)
Looking forward over the next two months there are encouraging signs based on tentative schedules planned until the middle of the year. The question is : How many of these planned flights will actually operate? Even the most optimistic of us would seem it unlikely, but if a notable proportion do, we can perhaps then start to properly talk about recovery.