In the case of South Pacific it is another stable month of year-on-year capacity growth with OAG schedule data showing an additional 300,000 seats available on flights within and from the region for the month ahead compared to Nov-2016.
Overall network capacity from the South Pacific is up 2.6% in Nov-2017 versus the same month last year, the ninth consecutive month of year-on-year growth following the small -0.5% decline recorded in Feb-2017 (due to the additional leap year day in Feb-2016). This is down 0.8 percentage points on last month one of the strongest performing months in 2017 but marks a return to the annual trend line. The year average now stands at a healthy 2.7% growth delivered mainly by above average performance in the Mar-2017 to Aug-2017 window.
CHART - Network capacity growth from and within the South Pacific has shown stability through 2017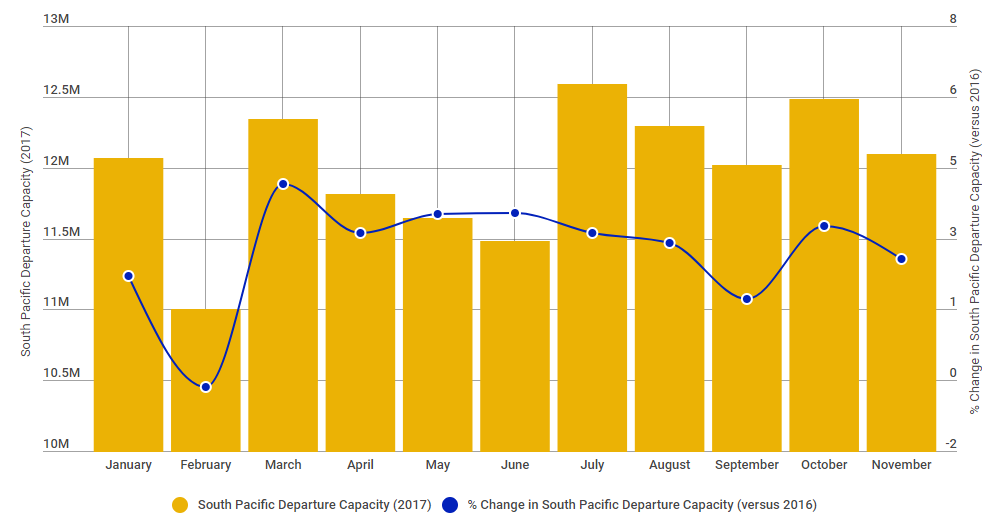 Source: The Blue Swan Daily and OAG
A slightly worrying trend had seen the rate of growth decline from May-2017 through to Sep-2017 when the rate fell to just 1.6%, the lowest monthly decline in real terms when you account for the extra February day in 2016. However, full month data for Oct-2017 show a healthy 3.3% rise and the forecast for the month ahead returns to just below the 2017 average.
The performance of the region is heavily tied towards activities in Australia which accounts for almost three quarters of all capacity from the South Pacific (including all intra-South Pacific activity). Departure capacity from the more mature Australian market has grown 1.3% through the first ten months of 2017 and set to grow 1.7% year-on-year in Nov-2017 and 2.0% in Dec-2017. However, growth in other parts of the region mean Australia's share of regional capacity will decline from 73.8% in 2016 to around 72.8% this year.
Australia is home to the region's three largest airports in Sydney, Melbourne and Brisbane and all are expected to record stronger year-on-year growth in Nov-2017 to YTD performance, according to the advanced schedule data. In Sydney, departure capacity is set to rise 3.2% in Nov-2017 versus 2.9% in the first ten months, while in Melbourne capacity will be up 3.8% versus 1.9% and in Brisbane there will be capacity growth of 1.0% versus 0.9% for the year to date.
Our analysis shows that the strongest year-on-year growth in the South Pacific is being seen in Kiribati where departure capacity is up 181.7% across the first ten months of the year, and in the Northern Mariana Islands where a growth of 62.0% has been recorded across the same period, Noticeable capacity rises have also been recorded in 2017 from the Marshall Islands (up +41.1%), Tonga (+31.1%), New Caledonia (+23.3%) and the Solomon Islands (+18.0%).
CHART - Air capacity within and from the South Pacific is up 2.7% in 2017 (Jan-2017 to Oct-2017) with an additional 3.1 million seats being added to the market during that period, lead by New Zealand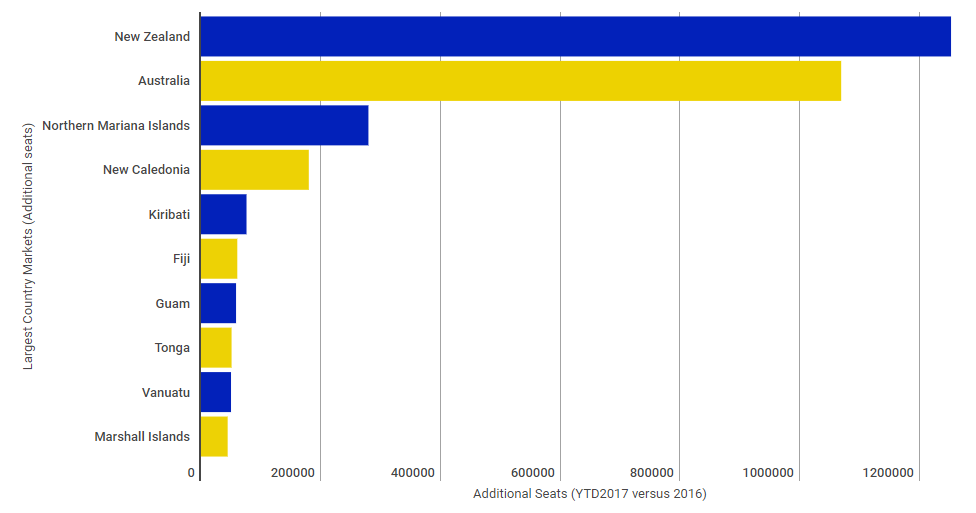 Source: The Blue Swan Daily and OAG