In late 2011, Tampa International Airport officials began the process of updating the Master Plan for the airport's 3,300-acre campus. The final plan, approved in 2013, allows the airport to accommodate up to 35 million passengers each year, and is divided into three distinct phases: Decongestion, enabling and expansion. It allows a "build as demand dictates" approach to growth, with phases based on passenger volume.
The first phase, which is scheduled for completion this year, helps decongest the curbsides, roads and Main Terminal, and includes a 2.6 million-square-foot Rental Car Center, a 1.4-mile automated people mover and an expansion of the Main Terminal.
Phase 2 includes a curbside expansion and 17-acre commercial development around the rental car center. The commercial development area will feature an office building, convenience store with gas station, hotel, a commercial curb to accommodate transit and other ground transportation, and connections to regional trail networks. The curbside expansion includes new express lanes exclusively for passengers without checked luggage. Mwanwhile, Phase 3, the expansion phase, includes the construction of a new Airside D with 16 gates capable of handling both domestic and international flights.
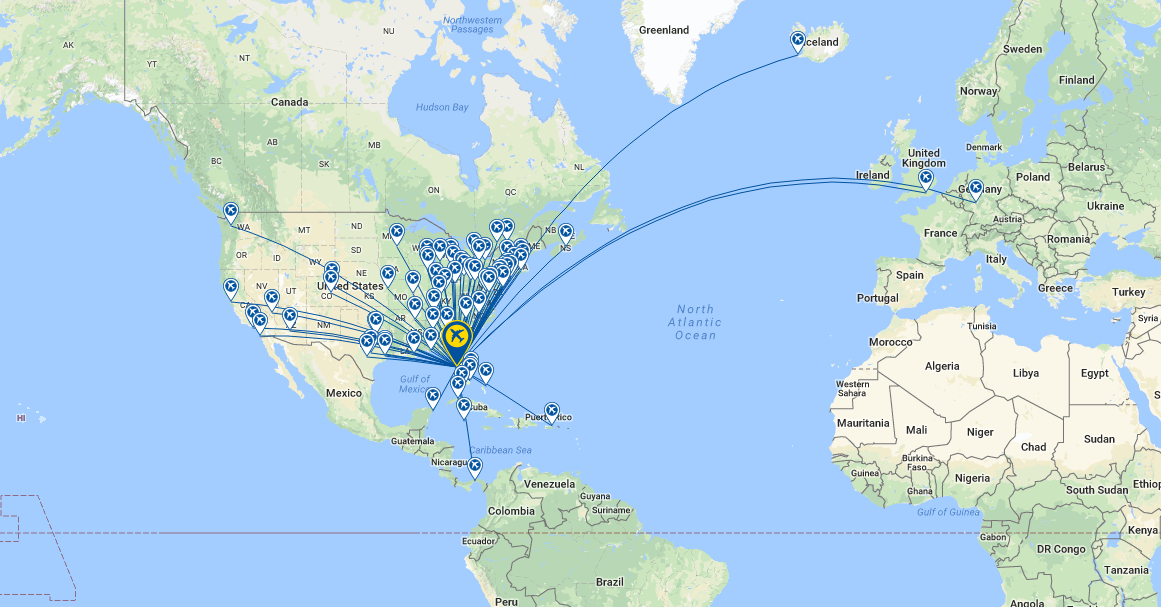
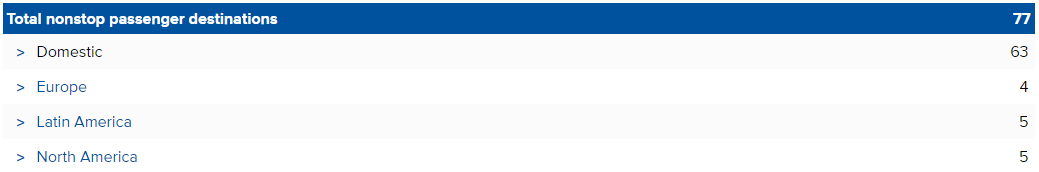
NETWORK: According to flight schedules from OAG for the week commencing 08-Jan-2018, Tampa International Airport is directly linked to 77 destinations, with all but 14 of these currently being domestic markets. This is an 81.8% domestic share by destination, a percentage that increases both by capacity and movements. The international network is focussed on the Americas with five destinations across five countries in Latin America and five across other points of North America (four in Canada and San Juan, Puerto Rico). Four destinations are served in Europe supporting the strong trans-Atlantic leisure flows into Tampa, These comprise a British Airways service from London Gatwick, a Lufthansa link from Frankfurt, an Edelweiss Air flight from Zurich and an Icelandair operation from Reykjavik.
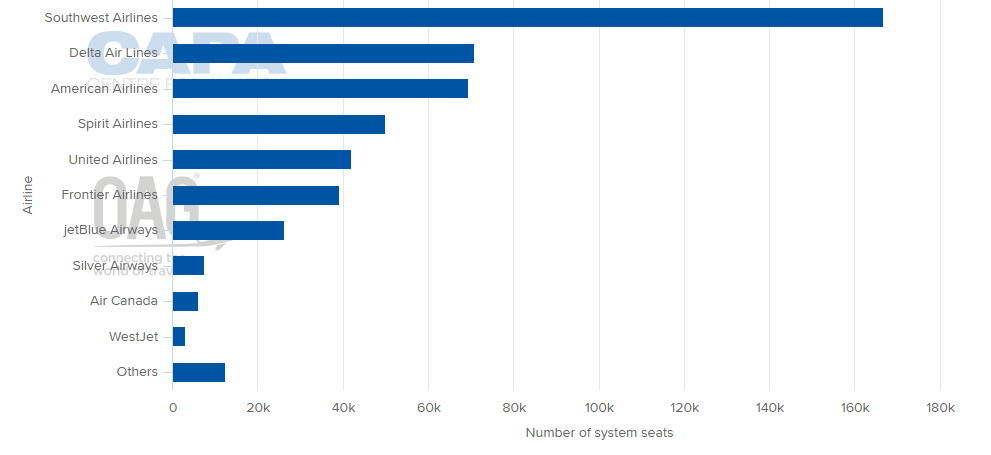
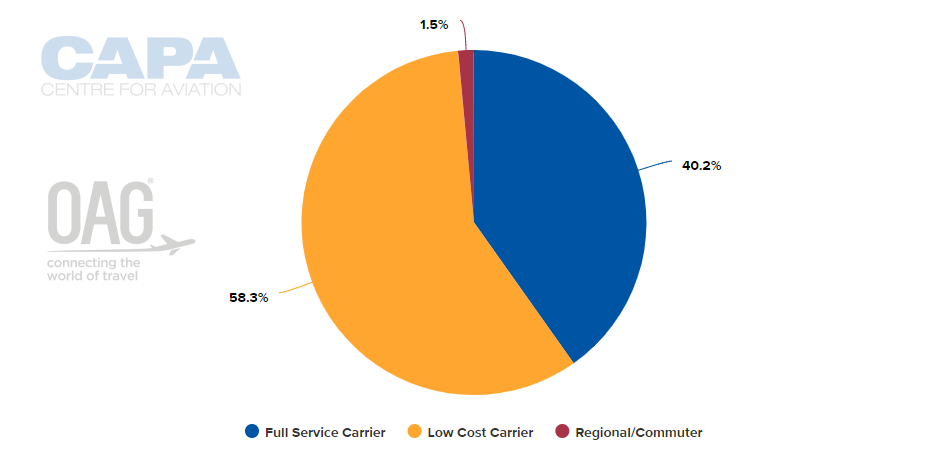
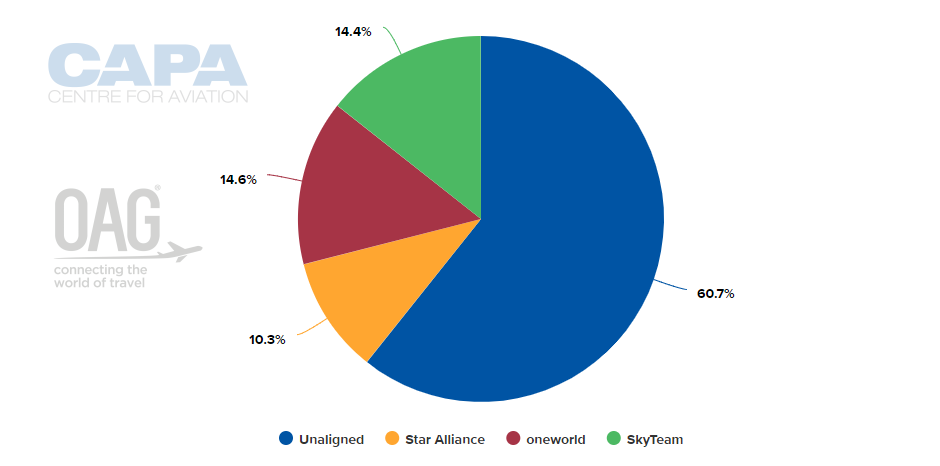
AIRLINES: Southwest Airlines is the dominant carrier at Tampa International Airport with a 33.9% share of capacity and a 33.4% share of aircraft movements during the week long analysis period. In the domestic market it holds a 34.6% market share, more than double the levels of its closest rivals Delta Air Lines (15.0% share) and American Airlines (14.8% share). In the international market it cedes that market dominance to Air Canada (24.7% share), ranking behind with a 21.4% share itself. Southwest' strong positioning at the airport means that the LCC sector dominates at Tampa with a 58.3% share during the analysis period and means none of the global alliances dominates; although Air Canada may be the largest operator it is actually Oneworld (14.6% share) and SkyTeam (14.4% share) that have the larger shares ahead of Star (10.3% share).
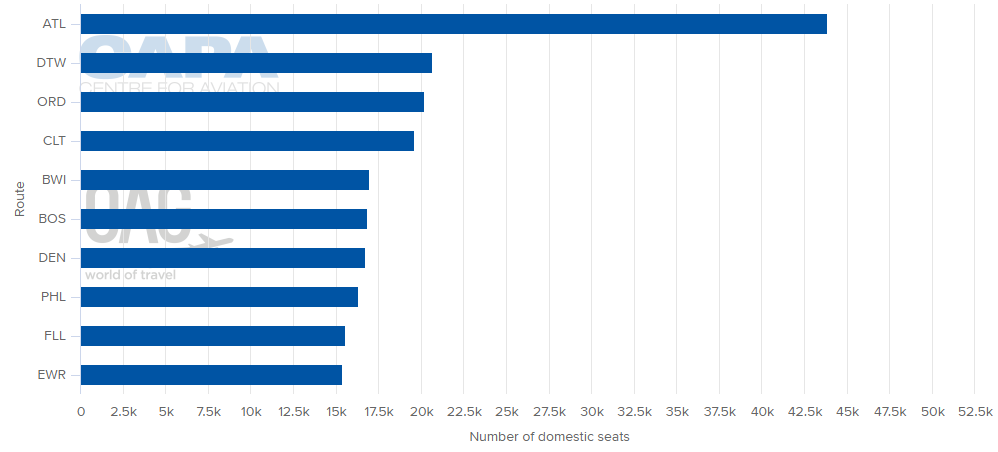
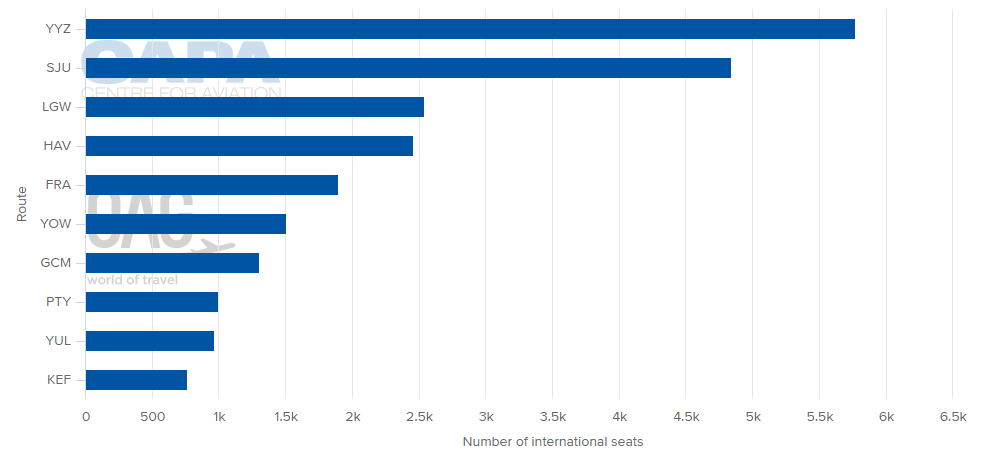
DESTINATIONS: The biggest route from Tampa International Airport based on this week's schedule is to Atlanta's Hartsfield-Jackson International Airport - still the world's largest airport. This route pair accounts for 8.9% share of total system seats, more than double that of the closest others, Detroit Metropolitan Wayne County (4.2% share), Chicago O'Hare International (4.1% share) and Charlotte Douglas International (4.0% share). Outside of the dominant domestic flows prevalent at Tampa International Airport it is Lester B Pearson International Airport in Toronto, Canada that is the largest international market, ahead of San Juan's Luiz Munoz Marin International Airport in Puerto Rico and London Gatwick Airport in the United Kingdom.
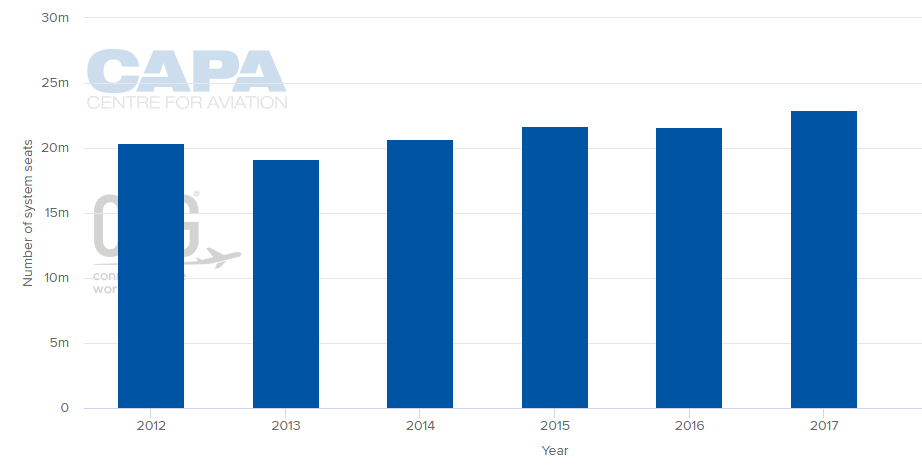
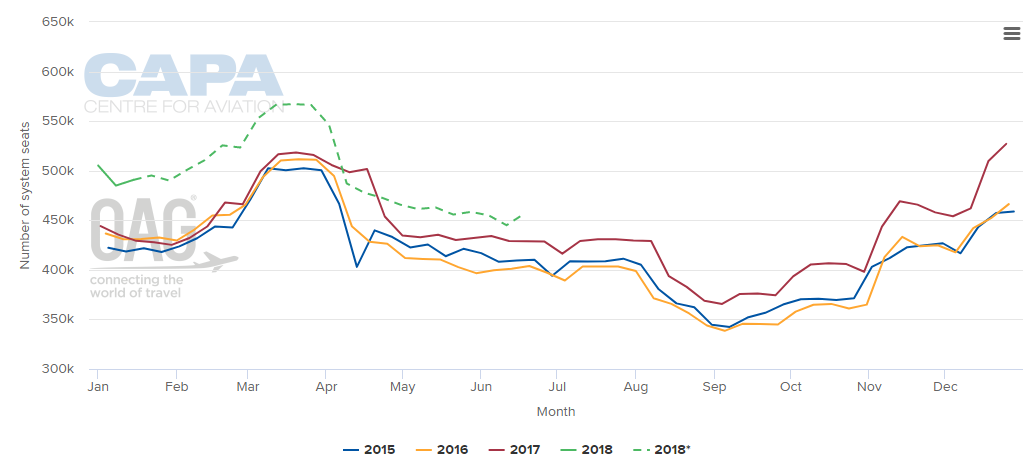
CAPACITY: The second fastest annual rate of capacity growth over the past five years was recorded at Tampa International Airport in 2017 with system capacity rising +6.2% year over year. This followed a small decline of -0.4% in capacity in 2016. Over the past five years total system capacity has risen +12.4% with the highest gains being seen in the international market (up +47.0% and +13.3% in 2017), versus domestic skies (up +10.9% and +5.8% in 2017). Looking ahead, published schedules show that apart from a short period in Apr-2018, this coming year's capacity is tracking ahead of 2017, with a forecast +11.3% year over year rise across Q1 and +8.8% across H1 versus the same periods last year.
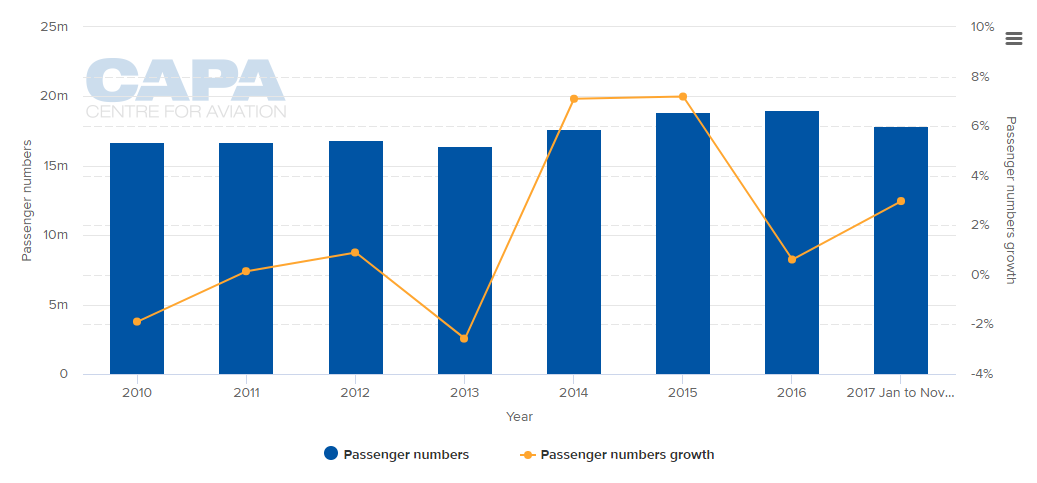
TRAFFIC: After reporting just modest (+0.6%) passenger traffic growth in 2016, Tampa International Airport was expected to end 2017 with around a +3.0% uplift in demand, helping it to exceed the 19 million passengers per annum milestone. Over the first eleven months the airline handled just under 18 million and was forecasted to end the year close to the 19.5 million annual passenger figure. This figure is down on the +7.1% and +7.2% year over year growth recorded in 2014 and 2015, respectively, but still represented the third fastest rate of annual growth this decade.
VISIT CAPA - Centre for Aviation to find out how you can access all this information and discover more about the benefits of a CAPA Membership.